

Chicago election results: Map shows breakdown of votes for mayor by neighborhood

Paul Vallas, Brandon Johnson on collision course for Chicago mayoral runoff
Political analysts Thom Serafin and Pat Brady weigh in on last night's election results and talk about storylines they anticipate ahead of the April 4 mayoral runoff.
CHICAGO - It was another history-making election for the city of Chicago.
Lori Lightfoot became only the second sitting mayor in 40 years to lose a bid for re-election. She will leave office May 15, inauguration day for either Paul Vallas or Brandon Johnson.
While a record number voted by mail, the total voter turnout may end up slightly lower than in 2015 and 2019, when turnout was in the mid-thirties as a percentage of registered voters.
Vallas at 34% and Brandon Johnson at 20% finished ahead of Lightfoot, who won just 17.1% of the vote. That’s slightly lower than the 17.5% she won in the first round of voting in 2019.
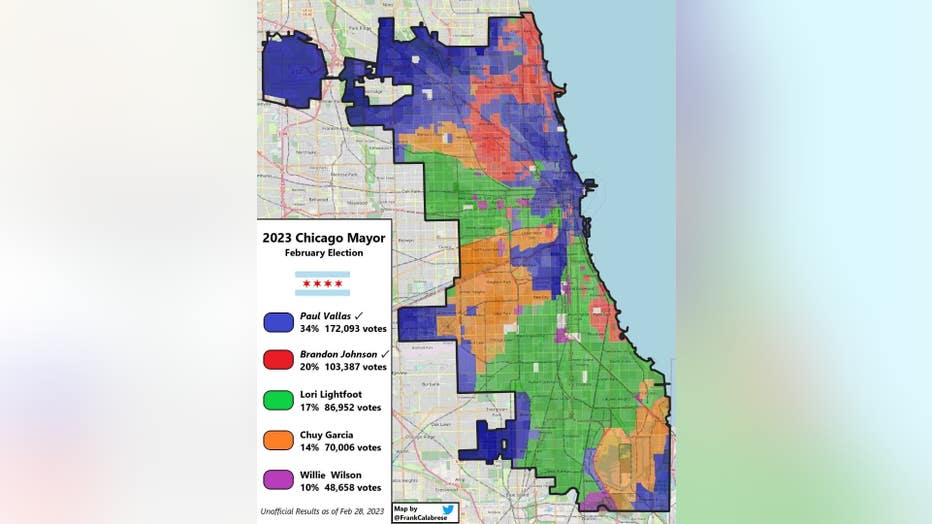
Map shows how Chicagoan's voted for mayor by precinct. (Courtesy of Frank Calabrese)
A map created by Northwestern graduate student Frank Calabrese shows how individual precincts across the city voted for mayor, using certified data from the Chicago Board of Elections.
First-place finisher Vallas won a large percentage of precincts on the North Side, as well as on the outskirts of the Southwest and Northwest Sides.
Johnson's supporters were mainly on the North Side – in neighborhoods such as Rogers Park, Edgewater, Uptown and Logan Square. He also had many supporters in the Hyde Park neighborhood.
Lightfoot's 17% came mainly from precincts on the South and West Sides.
Election officials expect another 50,000 to 80,000 vote by mail ballots to come in before the March 14 – cut off. Check back HERE as the final votes are tallied.